If you’ve spent any time looking at trading charts, you’ve probably seen candlestick charts. Each candle tells a small story about what happened to price during a certain time period. Understanding them can help you make better trading decisions, whether you’re looking for a quick scalp or a longer day trade.

What is a Candlestick?
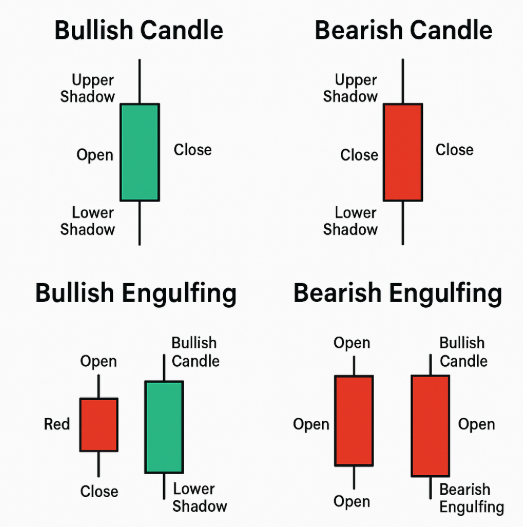
A candlestick shows the open, high, low, and close price for a specific time frame (for example, a 5-minute candle shows price movement in that 5-minute period).
It’s made up of:
- The Body – the thick part showing the distance between the open and close.
- The Wick (or Shadow) – the thin lines above and below the body showing the highest and lowest price reached.
Bullish Candles vs Bearish Candles
Bullish Candle
- Colour: Often green or white.
- Close price is higher than the open price.
- Suggests buyers were stronger than sellers during that time.
Bearish Candle
- Colour: Often red or black.
- Close price is lower than the open price.
- Suggests sellers were stronger than buyers during that time.
Image idea: Side-by-side visual of a bullish (green) and bearish (red) candle with labels for open, close, high, and low.
Why Candle Structure Matters
By looking at the shape and size of the candle, you can spot who’s in control — buyers or sellers — and whether momentum might continue or reverse.
Common Bullish Candlestick Patterns
1. Bullish Engulfing
- A small bearish candle followed by a larger bullish candle that completely “engulfs” the first.
- Suggests strong buying pressure.
2. Hammer
- Small body at the top with a long lower wick.
- Shows sellers pushed price down, but buyers fought back before close.
3. Morning Star
- Three-candle pattern: bearish candle, small indecision candle (doji/spinning top), then a strong bullish candle.
- Often signals a reversal to the upside.
Image idea: A chart snippet with each bullish pattern highlighted and labelled.
Common Bearish Candlestick Patterns
1. Bearish Engulfing
- A small bullish candle followed by a large bearish candle that engulfs it.
- Suggests strong selling pressure.
2. Shooting Star
- Small body at the bottom with a long upper wick.
- Shows buyers pushed price up, but sellers forced it back down before close.
3. Evening Star
- Opposite of Morning Star: bullish candle, small indecision candle, then a strong bearish candle.
- Often signals a reversal to the downside.
Image idea: A chart snippet with bearish patterns labelled.
Neutral / Indecision Candles
Doji
- Open and close are almost equal, forming a thin body.
- Signals market indecision — neither buyers nor sellers won that period.
Spinning Top
- Small body with long wicks on both sides.
- Also shows indecision, but with more movement during the candle.
How to Use Candlestick Patterns in Day Trading
- Combine with Support/Resistance – Patterns are more reliable at key price levels.
- Look for Volume Confirmation – Higher volume can make the signal stronger.
- Use in a Trading Plan – Don’t rely on patterns alone; combine them with other analysis.
Bottom line: Understanding candle structure is a core skill for day trading beginners. Bullish and bearish patterns can hint at market direction, but they work best when combined with other tools like trendlines, indicators, and solid risk management.

